Bitcoin Price Analysis: Can BTC Reach $80K?
翻訳を準備中です。英語の原文を表示しています。英語の原文を見る
文字サイズ本文を読む ↓
画像を読み込み中
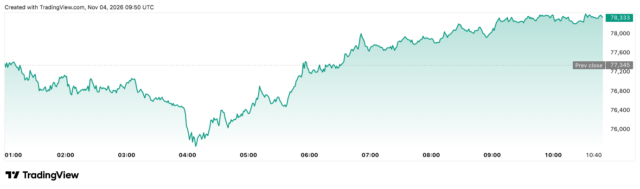
Bitcoin Price Analysis is back in focus after BTC staged a sharp V-shaped recovery following the US midterm elections. After briefly dropping below $76,000, Bitcoin rebounded toward $78,000, raising an important question: Can buyers overcome key resistance levels and push BTC toward $80,000? However, one important technical obstacle remains. Despite the recovery, Bitcoin continues to […]

Bitcoin Price Analysis is back in focus after BTC staged a sharp V-shaped recovery following the US midterm elections. After briefly dropping below $76,000, Bitcoin rebounded toward $78,000, raising an important question: Can buyers overcome key resistance levels and push BTC toward $80,000?
However, one important technical obstacle remains.
Despite the recovery, Bitcoin continues to face resistance from its four-hour moving-average structure, suggesting that buyers have not yet regained control of the short-term trend.
We believe the next meaningful move could depend on whether BTC can reclaim its hourly 200-period exponential moving average (EMA).
Bitcoin’s V-Shaped Recovery Catches Attention
The initial market reaction surrounding the US midterm elections created considerable volatility across cryptocurrencies and traditional financial markets.
Bitcoin briefly slipped below $76,000 before recovering toward $78,000.
That represents a rebound of at least 2.6% from the $76,000 reference level.
The speed of the recovery suggests that buyers responded to lower prices, although the move alone does not establish whether fresh demand or short covering was primarily responsible.
As we discussed in our Bitcoin midterm election coverage, the election period has presented an unusual test for BTC’s longer-term trend.
With the voting now concluded, attention is shifting toward liquidity, market positioning, and technical resistance.
The H1 200 EMA Could Determine Bitcoin’s Next Move
The hourly 200 EMA is one of the most important indicators to monitor in the current setup.
This moving average tracks Bitcoin’s average price over the previous 200 hourly candles while assigning greater weight to recent trading activity.
When Bitcoin trades below this indicator, traders often interpret it as a sign of weaker short-term momentum.
A confirmed move above the H1 200 EMA could therefore suggest that buyers are beginning to regain control.
However, we would want to see more than a temporary breakout.
Ideally, BTC would reclaim the indicator, successfully retest it as support, and establish higher lows.
That sequence would provide stronger evidence that the rebound has room to continue.
Why the Four-Hour Chart Still Matters
Even if Bitcoin recovers above its hourly 200 EMA, the four-hour chart presents another challenge.
The H4 EMA and moving-average resistance zone has already rejected the recent recovery attempt, according to the technical setup we’re examining.
This suggests that sellers remain active at higher prices.
A successful hourly breakout could open the door to a relief rally toward the four-hour resistance area, but that does not guarantee a broader trend reversal.
We believe traders should distinguish between a short-term recovery and a confirmed change in market structure.
A move above the four-hour resistance zone would strengthen the bullish case, particularly if accompanied by improving volume.
Could Bitcoin Make Another Run Toward $80,000?
With BTC trading near the $78,000 reference area, the psychological $80,000 threshold remains within reach.
A move from $78,000 to $80,000 would represent a gain of approximately 2.56%.
However, the path toward that level depends on several technical developments.
First, buyers need to reclaim the hourly 200 EMA.
Second, Bitcoin must overcome the four-hour moving-average resistance that has limited recent upside.
Finally, stronger confirmation would come from a sustained recovery above the daily EMA and moving-average structure.
Until then, the broader technical picture remains fragile.
Our previous coverage of Bitcoin’s decline below $80,000 illustrates how quickly leveraged market positioning can amplify price movements.
What We’re Watching Next
The midterm elections may be behind us, but Bitcoin still faces important tests.
We are watching whether buyers can establish the hourly 200 EMA as support, whether trading volume strengthens, and whether the four-hour resistance zone begins to weaken.
Broader market sentiment also matters.
Improving institutional demand and stronger risk appetite could support a recovery, while renewed selling pressure could send Bitcoin back toward its recent lows.
As we’ve seen in previous Bitcoin ETF market analysis, institutional positioning can provide useful context beyond daily price fluctuations.
For now, Bitcoin’s rebound is encouraging, but confirmation remains essential.
The next few trading sessions could reveal whether this V-shaped recovery is the beginning of a larger move or simply a temporary bounce within a weaker market structure.